Article by Aryan Totawat
The car market is one of many in the U.S. that has seen soaring prices over the past couple of years. In more normal times, it would be an aberration for a customer to pay above “sticker price” (more formally called a Manufacturer-Suggested Retail Price, or MSRP) for their car; they may even pay less than sticker price, as different dealerships compete for customers by lowering their prices. According to Edmunds, less than 1% of consumers paid above sticker price for their cars in January 2020, and about 3% of consumers did so in January 2021. But the bizarre realities of the pandemic economy have flipped the script: now, consumers are competing to buy scarce cars, driving prices up. In January 2022, as many as 82% of consumers paid above sticker price for their cars.
Economists and politicians alike have come up with many explanations for the ongoing inflation crisis. A frequent narrative promulgated by the Biden administration is that “corporate greed” has been the main driver of inflation. Corporate executives and business leaders, of course, have contested this narrative by pointing to a multitude of economic factors: commodity shortages, supply chain issues (like the notorious chip shortage impeding the production of new cars), and higher wages and labor costs, among others. Most economists agree that these factors are significant, but not all are convinced that they are sufficiently explanatory. Mark Paul, assistant professor of Economics at Rutgers University, alleges that “car companies are charging consumers above and beyond what should be considered a reasonable markup due to these market disruptions.” Perhaps an element of corporate greed is at play, and businesses are taking advantage of persistent demand to pad their own profits.
To analyze this claim, we can look at the variables that determined car prices in the pre-pandemic economy and develop a linear model. Then, we can try and estimate what car prices should be in the pandemic economy, by taking the linear model from prior years and feeding it variable data from the pandemic months. We can then compare these estimates to actual car prices during the pandemic. If the model accurately predicts car prices throughout the pandemic, then we can’t blame corporate greed for high car prices; on the other hand, if the model from previous years does not accurately predict car prices over the pandemic, then we can fairly suspect that there is indeed some new factor at play.
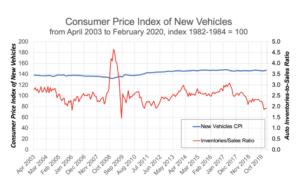
Assessing car prices and other data from April 2003 to February 2020, it turns out that four variables have been key in determining car prices: gas prices, the 12-month lagging federal funds rate (i.e., the interest rate set by the Federal Reserve Bank), the ratio of car inventories-to-sales, and the producer price index (PPI) of car manufacturing. Taken together, these four variables explain 88% of the variation in car prices over this nearly 17-year period. The graph below shows how the CPI for new vehicles has varied from April 2003 to February 2020, along with the variation in one of its determinants, the ratio of car inventories-to-sales.

In our linear regression model, gas prices and the PPI of car manufacturing are both positively related to car prices; as each of these variables increase, car prices also increase, and vice versa. It makes intuitive sense for car prices to vary positively with the PPI of car manufacturing; if it becomes more expensive to manufacture cars, producers will offset these costs to consumers by increasing car prices accordingly. Gas prices and cars are both normal consumption goods, and hence their prices usually trend in line with economic activity, rising together during periods of expansion and falling together during economic downturns.
Meanwhile, the 12-month lagging federal funds rate and the ratio of car inventories-to-sales are both negatively related to car prices; as each of these variables increase, car prices decrease, and vice versa. Again, it makes intuitive sense for car prices to vary negatively with the car inventories-to-sales ratio; if there are a lot of cars sitting in inventory relative to sales, dealerships will slash prices to get rid of inventory faster, whereas if there are very few cars sitting in inventory and a lot of consumers seeking to buy those cars – as is currently the case – dealerships will raise their prices. Meanwhile, the interest rate in the economy is a major policy tool wielded by the Federal Reserve Bank to influence economic demand. When the Federal Reserve hikes interest rates, consumers are incentivized to save rather than spend, and it also becomes more expensive to take out loans for big purchases like cars, leading to lower demand and lower prices. On the other hand, when the Federal Reserve lowers rates, consumers would rather spend their money and can take out car loans more cheaply, leading to higher demand and higher prices. We use the 12-month lagging interest rate because changing rates usually take some time to have a substantial economic impact through this chain of events.
We created this model for car prices based on pre-pandemic data for these four variables. Now we can look at car prices during the pandemic so far, from March 2020 to June 2022, and evaluate whether or not the same model still accurately predicts car prices over the pandemic. We first generate a variable that is essentially a prediction of car prices, by taking the relationships we obtained in our regression analysis for the pre-pandemic period and feeding it with pandemic-era data for the four determinant variables. Then, we test the relationship between the predicted car prices and actual car prices. It turns out that the correlation between this predictive estimate and actual car prices is 91.95%.
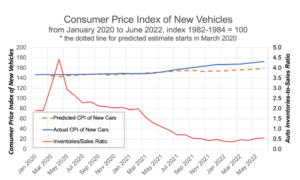
So actual car prices have been largely trending in the same direction they should be trending in. But if we run a regression where the dependent variable is actual car prices and the independent variable is predicted car prices, the linear relationship – despite being strong – does not have a coefficient of 1, but rather a coefficient of 1.83. So, although car prices have been justifiably increasing, the rate of the increase is almost double of what we would expect to see based on the pre-pandemic relationship between car prices and its determinants. The graph below shows how the CPI of new cars has grown at an accelerated rate, especially since July 2021, compared to our model’s prediction. We can also see how the car inventories-to-sales ratio has diminished greatly, as supply shortages of chips and other car parts have limited car manufacturing. The negative relationship predicted by our model becomes especially clear: as the inventories-to-sales ratio falls, car prices rise.

What will be interesting – and particularly telling – is the extent to which prices fall once the determinants switch courses. For the most part, gas prices and the production cost of car manufacturing have been rising, while interest rates (lagging by 12 months) and car inventories-to-sales have been falling; all of these have combined to send prices speeding upwards. These trends are all likely to reverse soon: lately, there has been talk of falling gas prices; supply chain bottlenecks will hopefully ease and bring down manufacturing costs; the Federal Reserve Bank has started hiking interest rates; and inventories should be restored once the supply chain irons itself out. Will car prices then also start falling at the accelerated rate at which they rose? If they do, then it would appear that our economy has entered a period of acutely sensitive prices. In terms of our model, this means that the same variables continue to determine car prices, but their coefficients have increased in magnitude over the pandemic. But if not (i.e., if prices refuse to come down as drastically as they went up), then only can we say for certain that profit-seeking businesses might indeed be driving car prices up.
